The Enterprise GHG Emission Accounting Platform is jointly developed by the Blue Map and Insblue.
The platform requires access to your account information
(including but not limited to your company name, registered cell phone number and email address)
to enable your use of relevant functions.
If you have any questions, please contact gsc@ipe.org.cn.
Product Carbon Footprint Accounting Platform is jointly developed by the Blue Map and Insblue.
The platform requires access to your account information
(including but not limited to your company name, registered cell phone number and email address)
to enable your use of relevant functions.
If you have any questions, please contact gsc@ipe.org.cn.

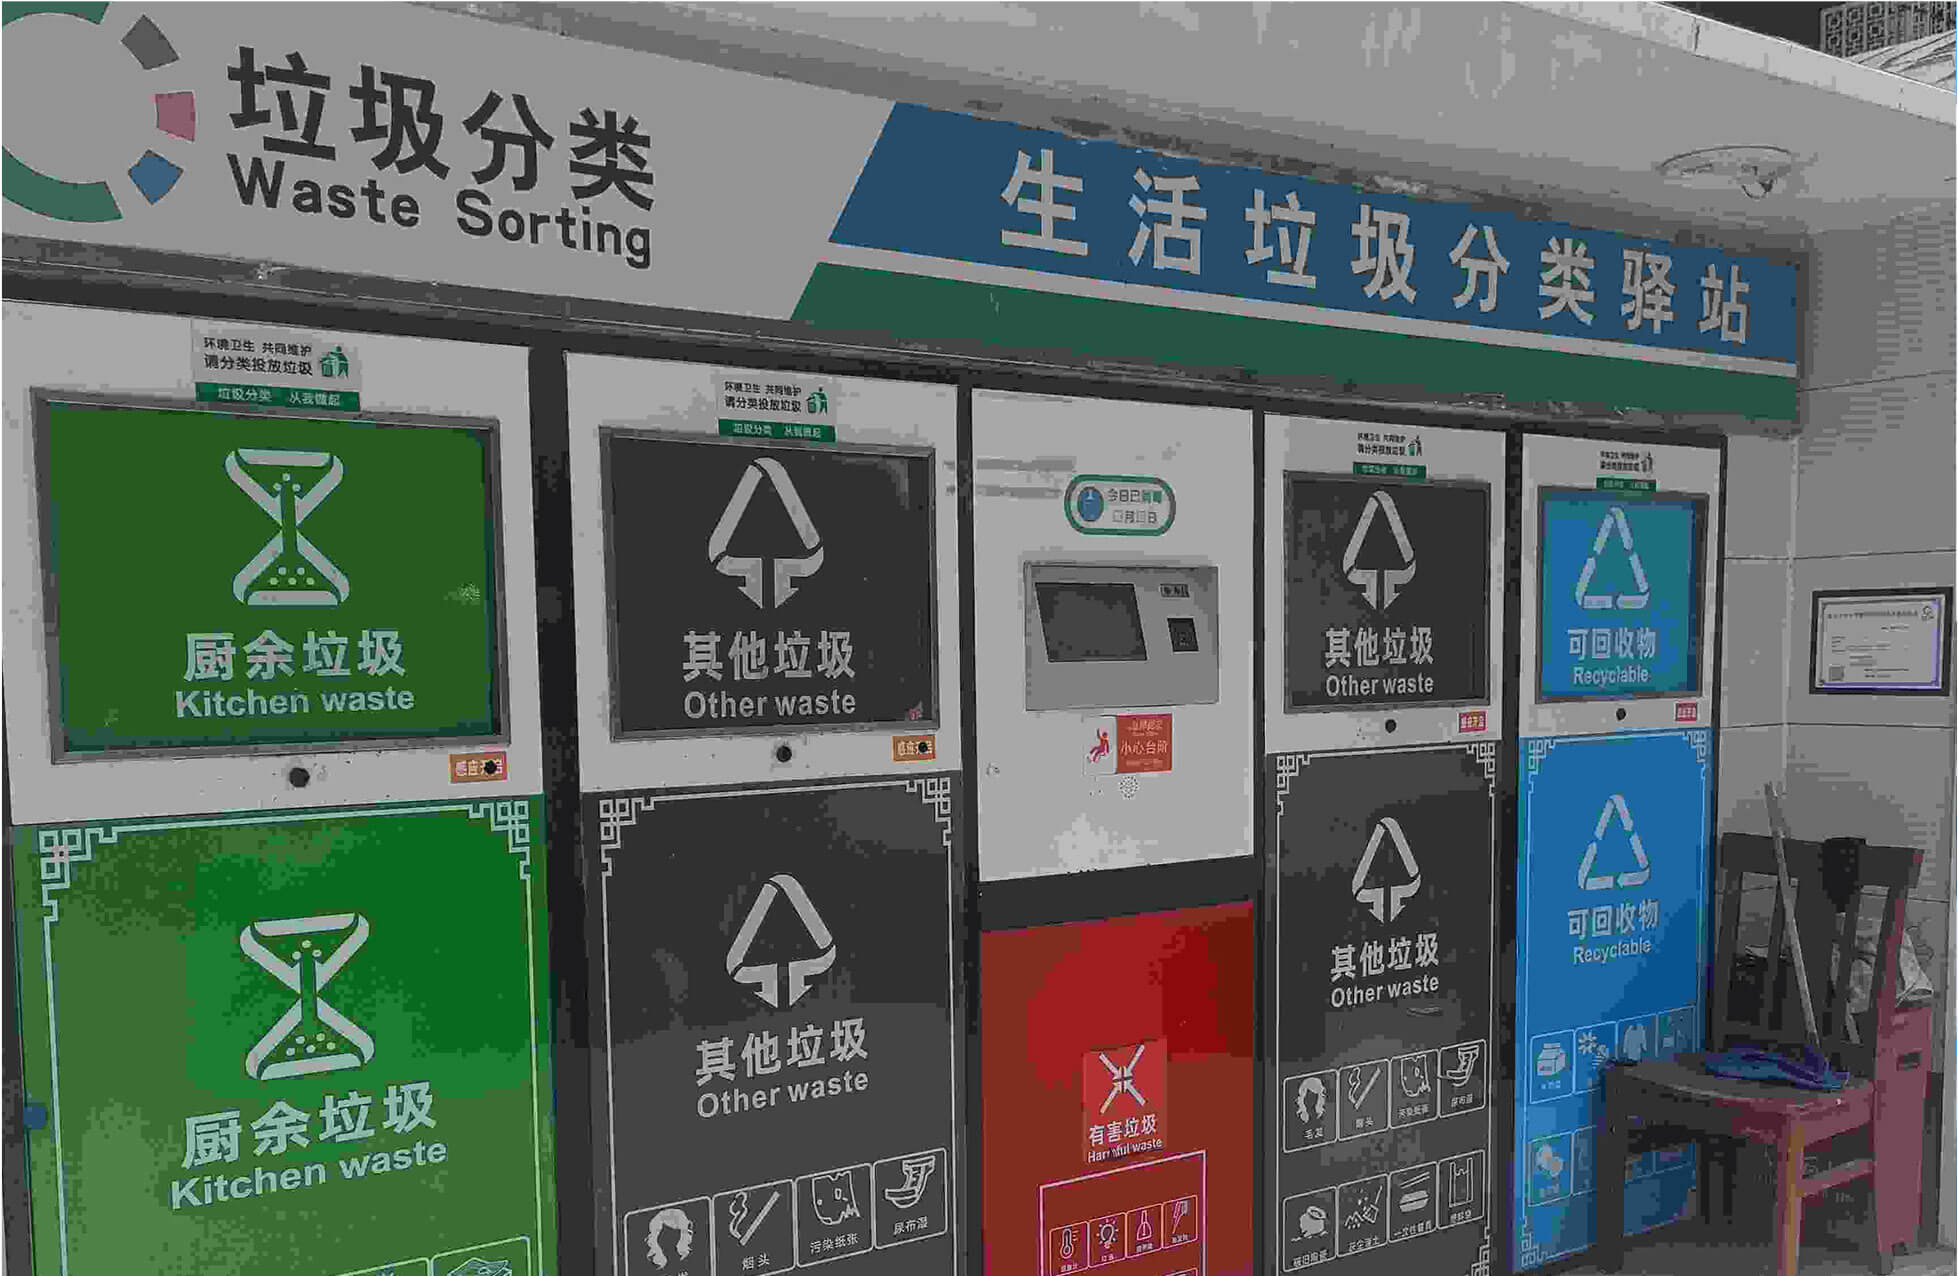
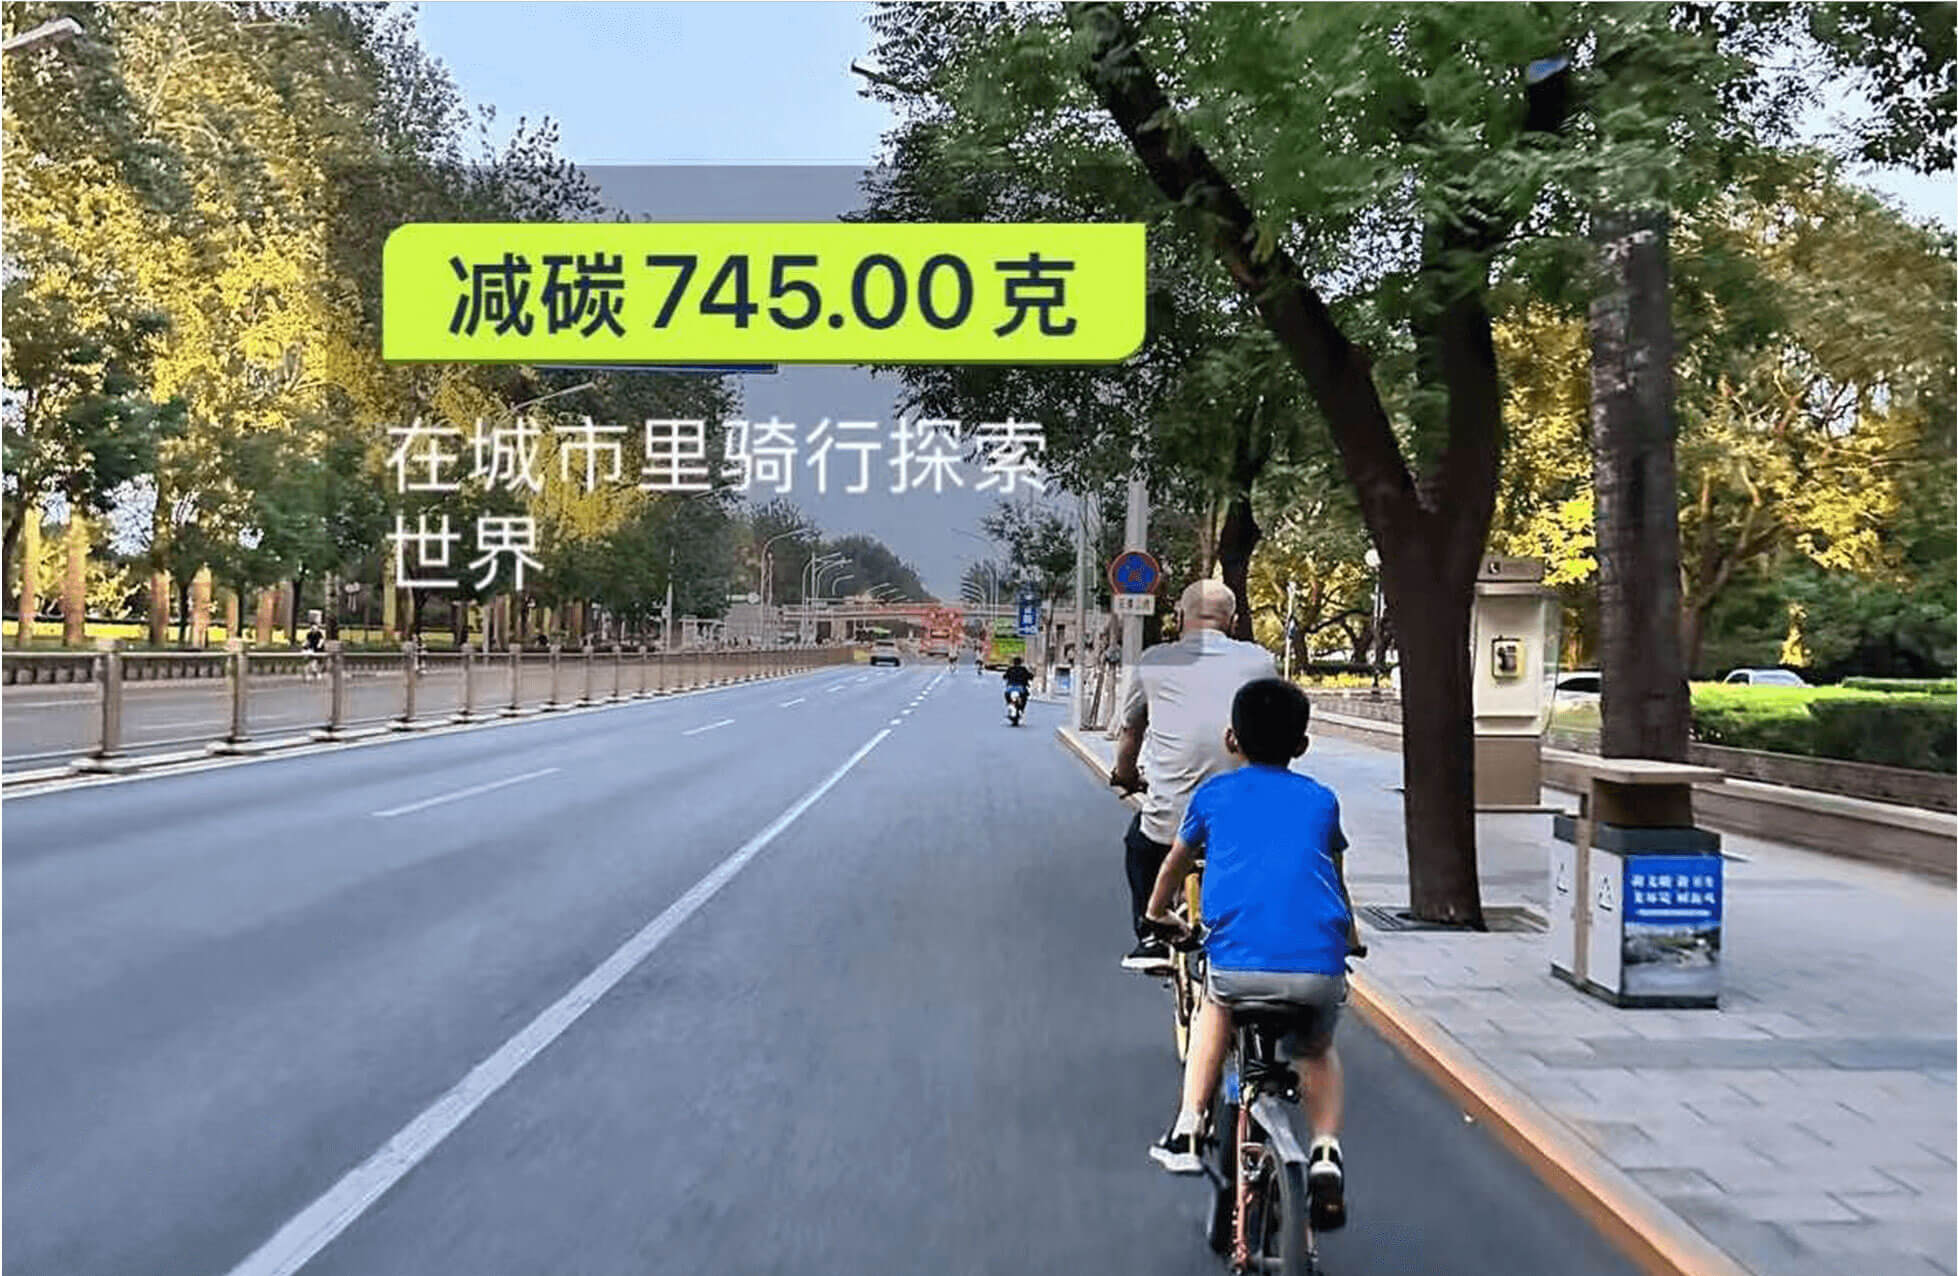
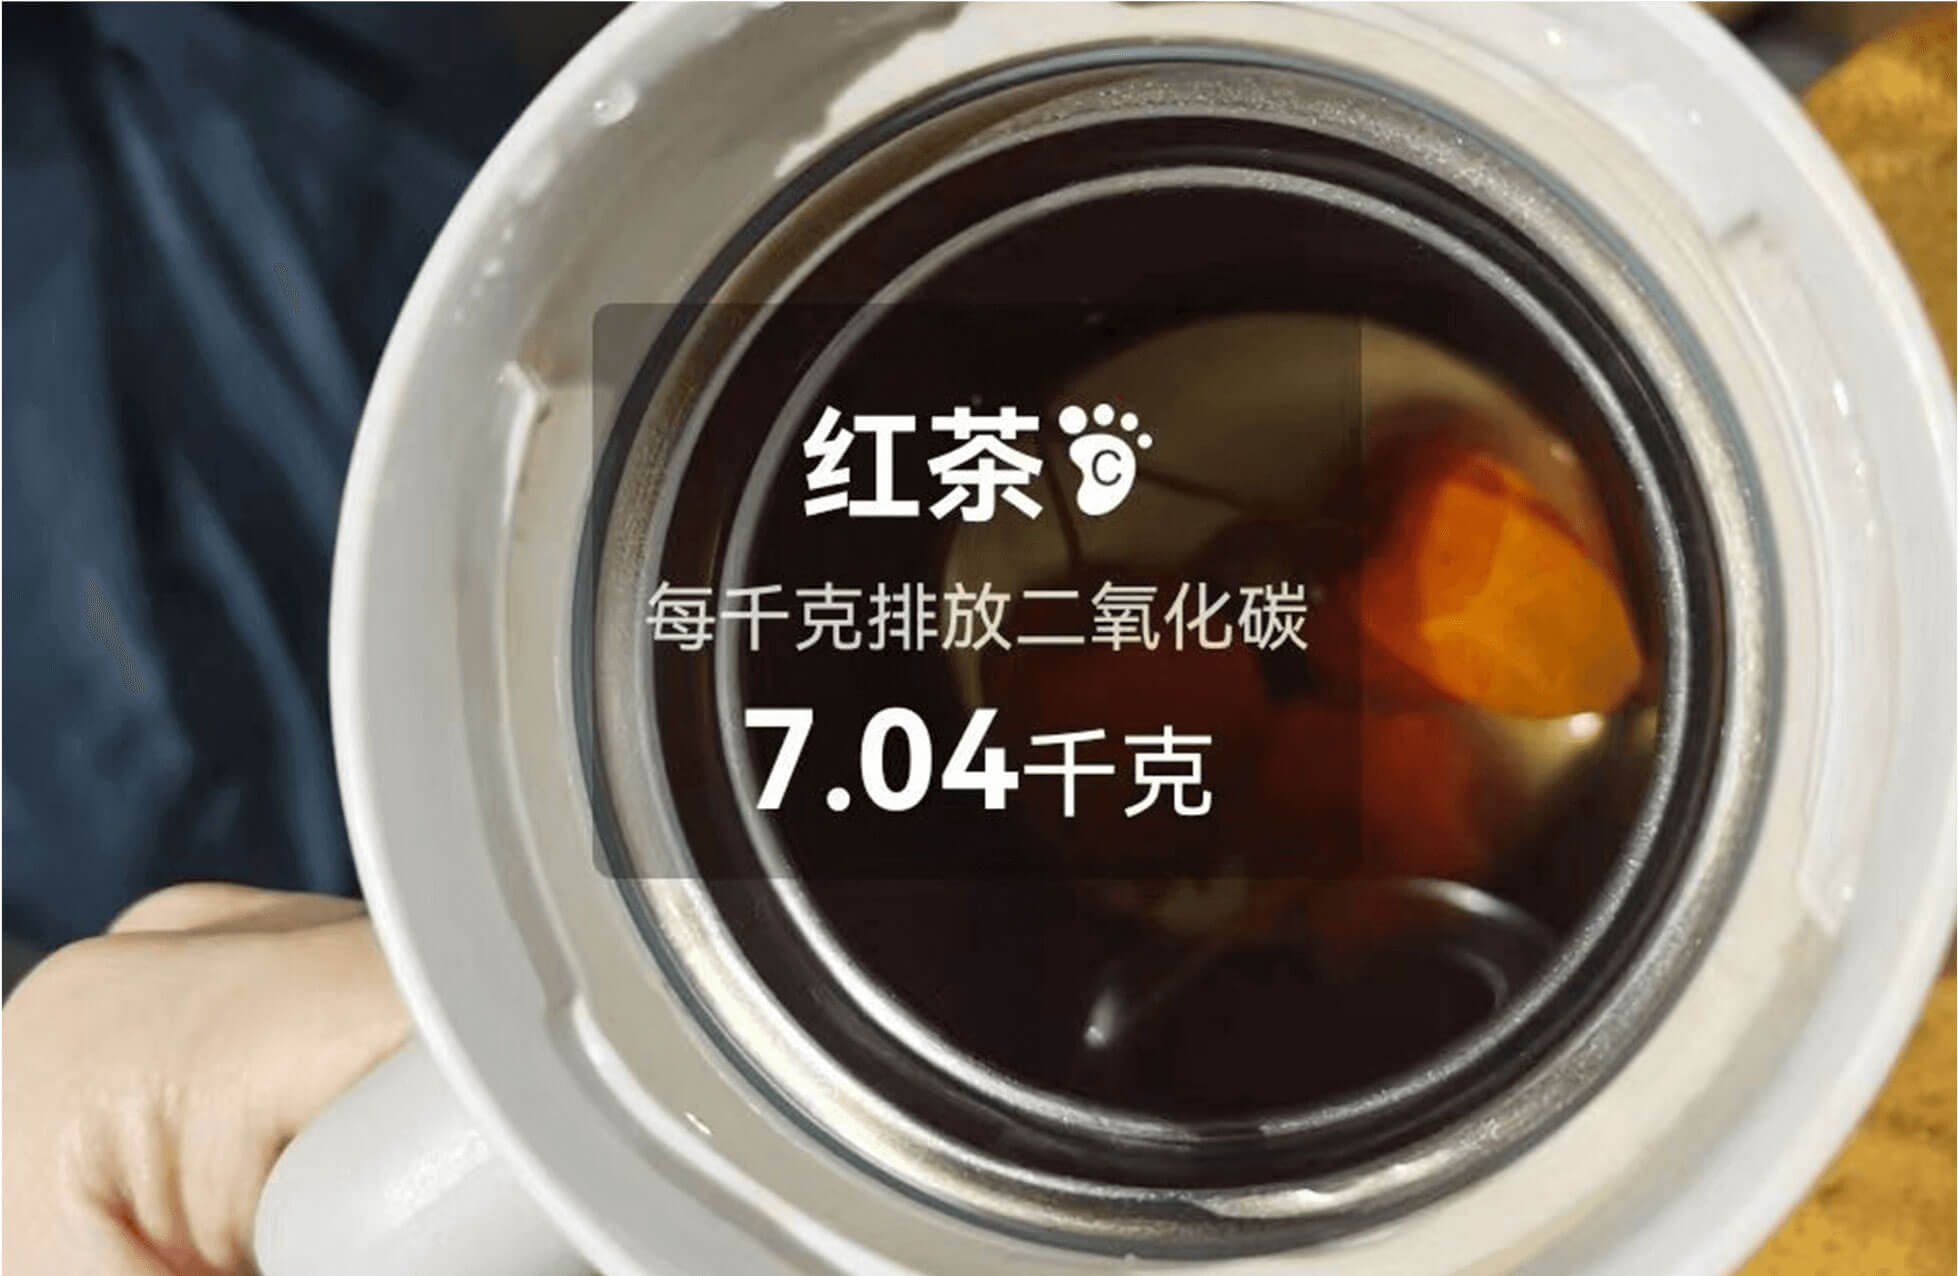
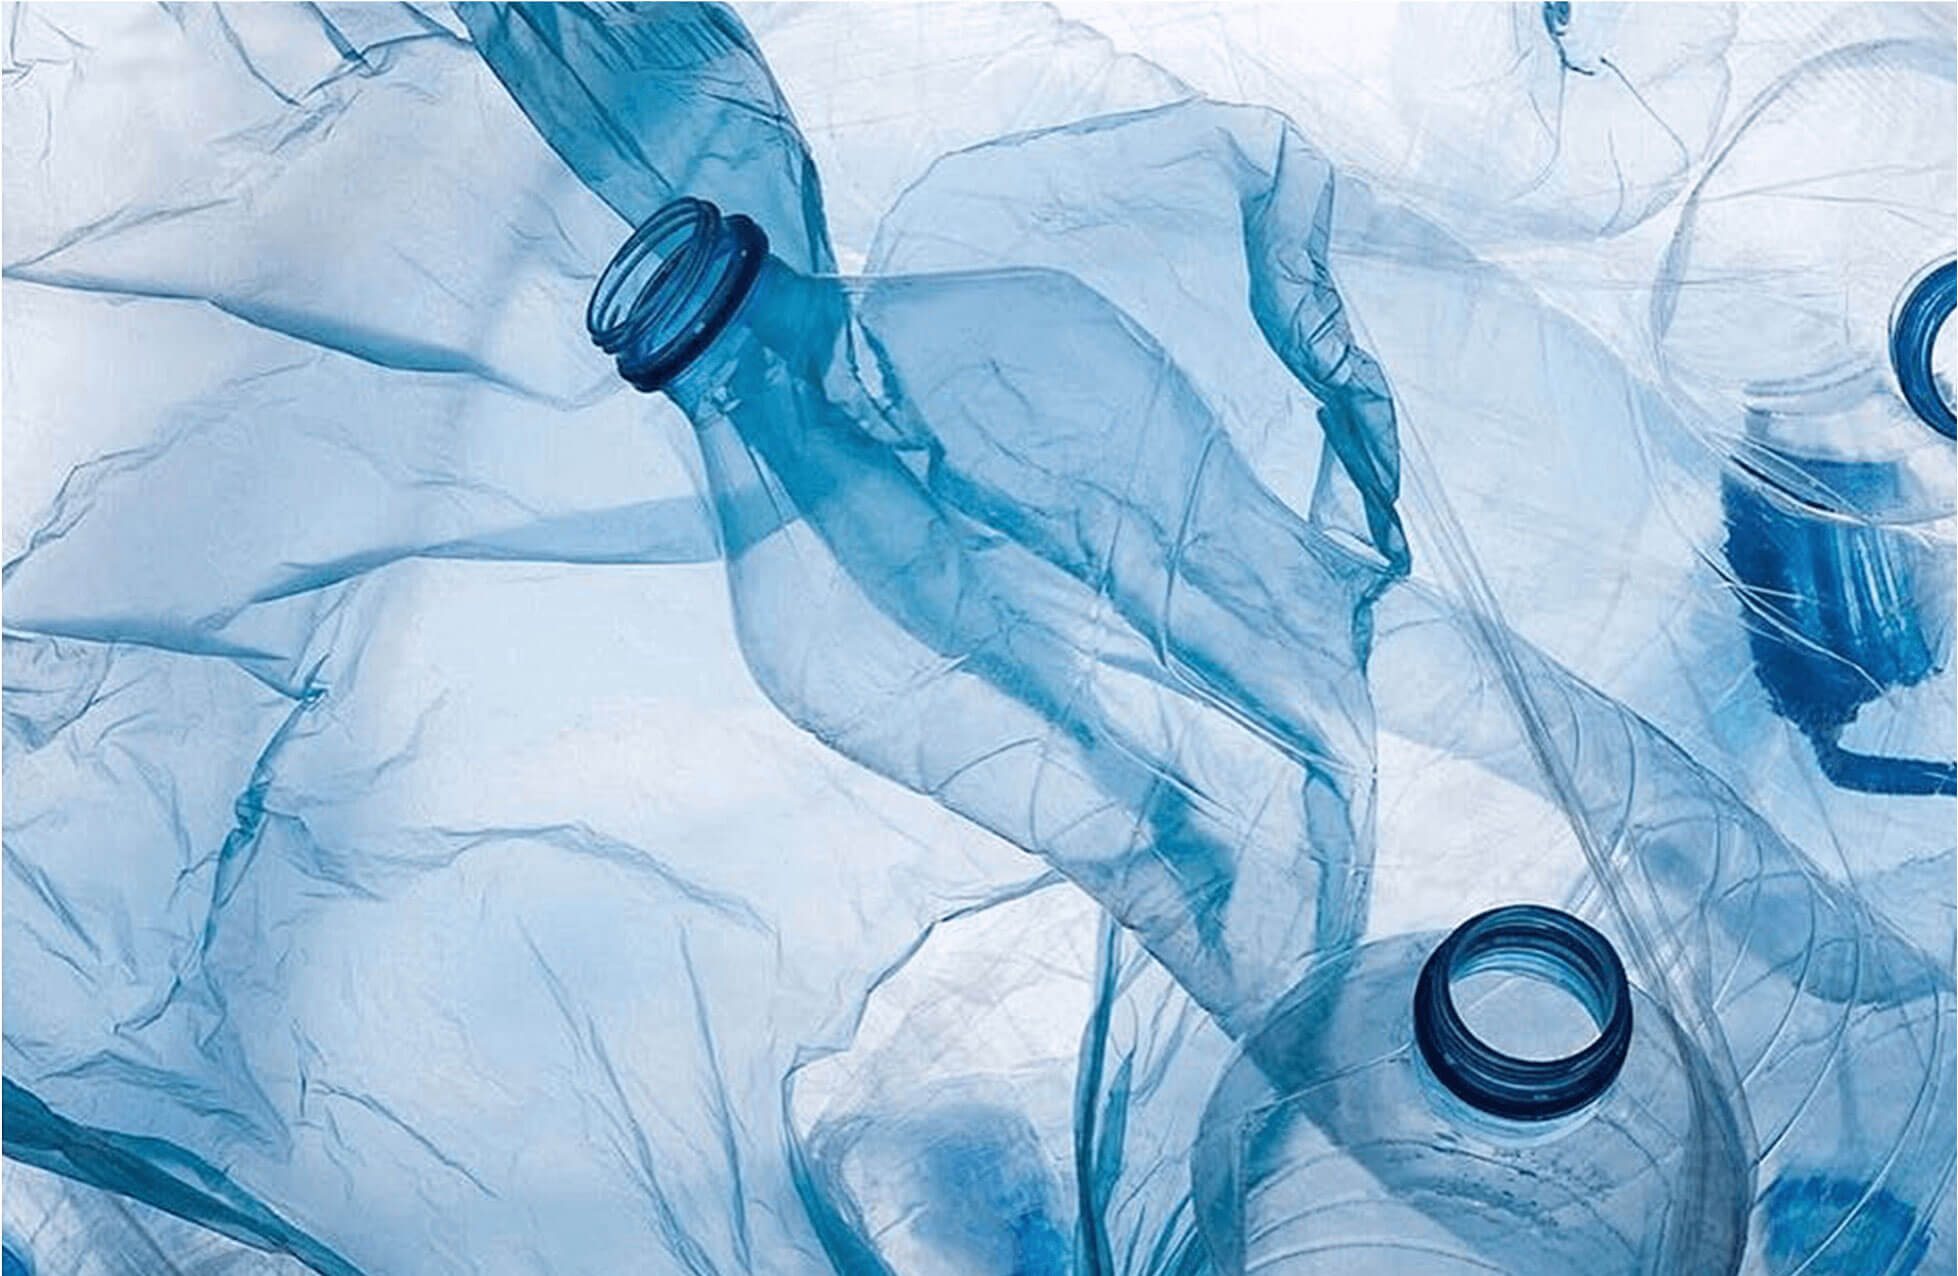
in the “Environmental Protection at Our Fingertips” initiative
shared by Blue Map users
views of the Weibo hashtag #EnvironmentalProtectionAtOurFingertips


- μg/m3
- %
- %
- tCO2e/10000RMB
30.0 (μg/m3)
79.45 %
- %
- %
- %
- %
- %
- %
- 104ton
- %
- %
- m2